

Six charts to change your mind about Michigan
Our state’s competitiveness ranges from poor to middling


Michigan’s economy is lagging behind that of the typical state right now, but our challenges go back many years. I hope these six charts help give a richer look at where Michigan stands and what lawmakers ought to do.
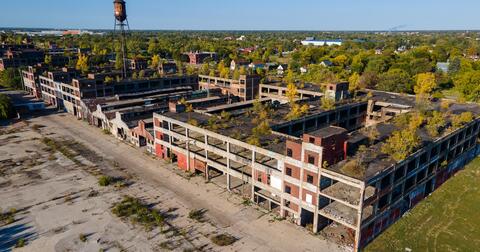
The first is a spotlight on auto and auto parts manufacturing jobs in Michigan compared to the number of auto jobs in the rest of the country.
Michigan has a little more than half of the auto and auto part manufacturing jobs it had in 2000, the peak year in the state. And Michigan has fallen further behind in its share of auto jobs even as employment recovered after the 2007-09 recession.
The Big Three are still large employers, and they produce a lot of vehicles. Lawmakers talk about the need to retain the future of the auto industry in Michigan. But at least as far as jobs are concerned, half are already gone, and it doesn’t look like they’re coming back. They have come back in other states, though.
In part because of this shift, any economic trend comparison between states that includes the period from 2000 to 2010 is going to have Michigan at or near the bottom. The state missed out on a decade of job growth.
But it’s not like the state’s been a paragon of growth since the end of the 2007-09 recession.
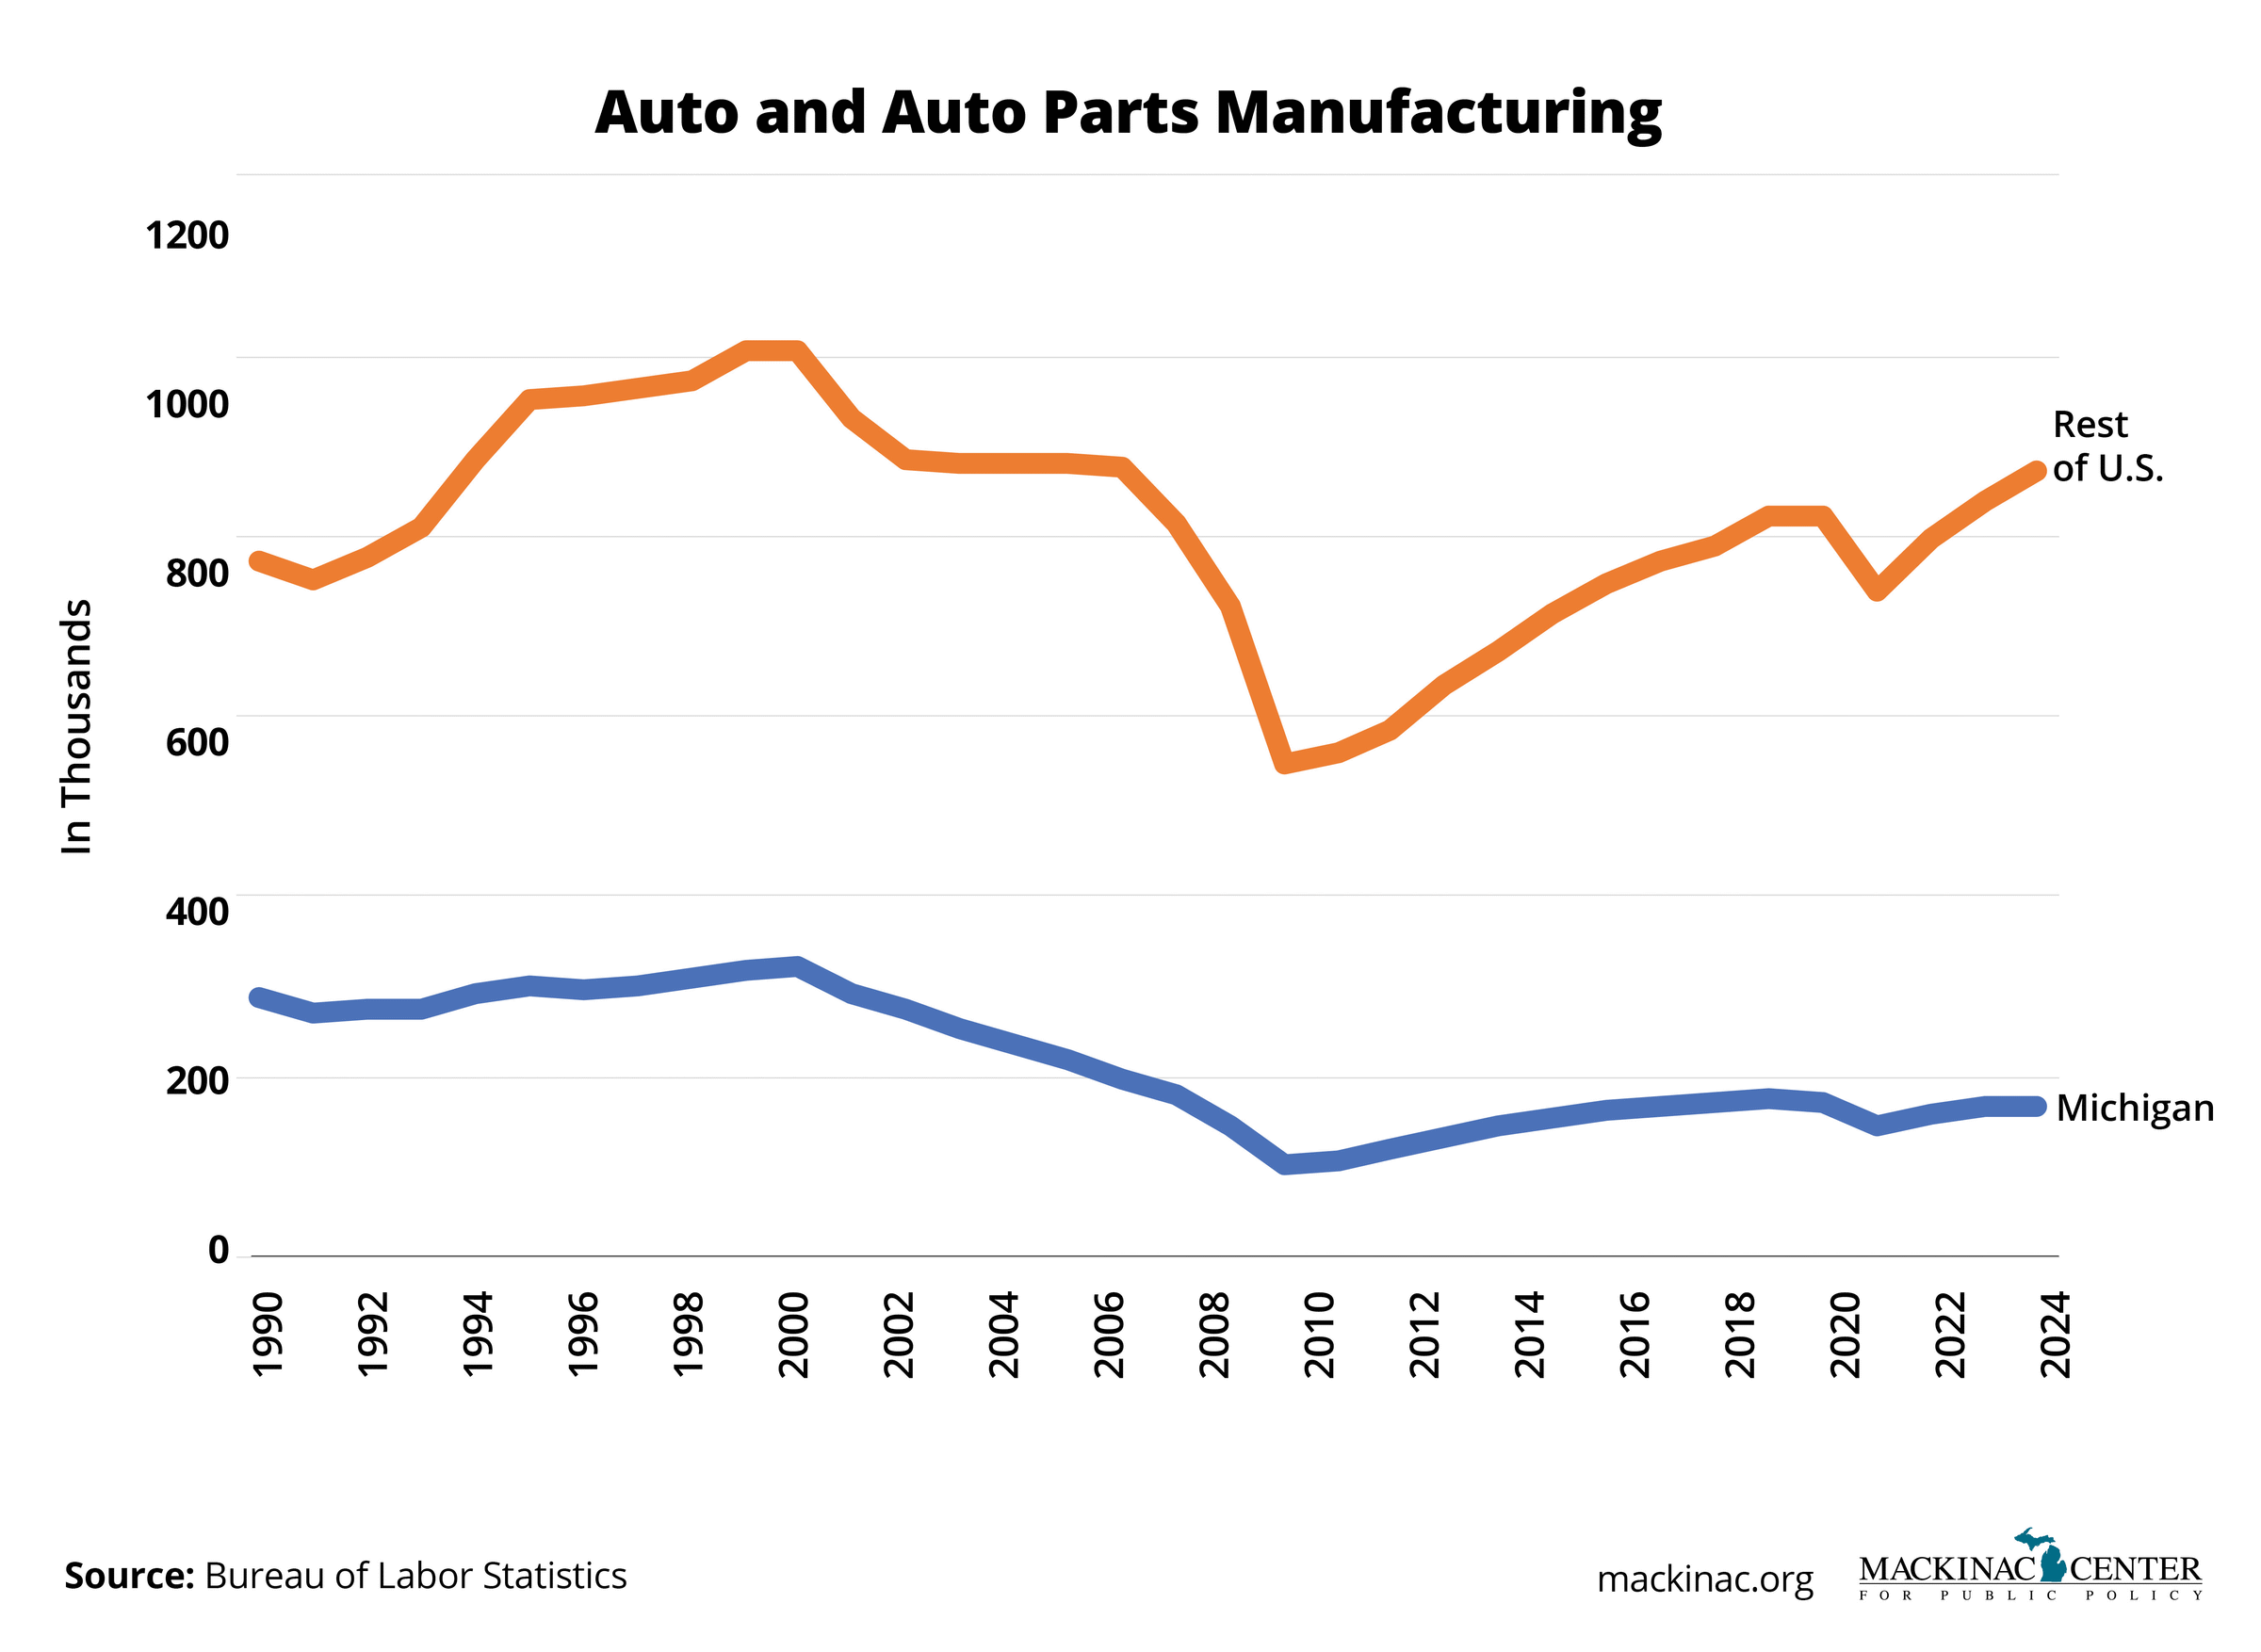
Our next chart shows the change in population since 2010. The top state is Idaho, where the state population increased 25% since 2010. West Virginia, the worst performer in the nation, was down 5%. Michigan comes in seventh from the bottom at 1.6%. North Carolina was up 13%, taking 14th place nationwide. The overall United States population increased by 8%.
The state’s population has stayed around 10 million people since 2000. Even though things were looking up in the 2010s from the losses in the 2000s, Michigan lags behind most states.
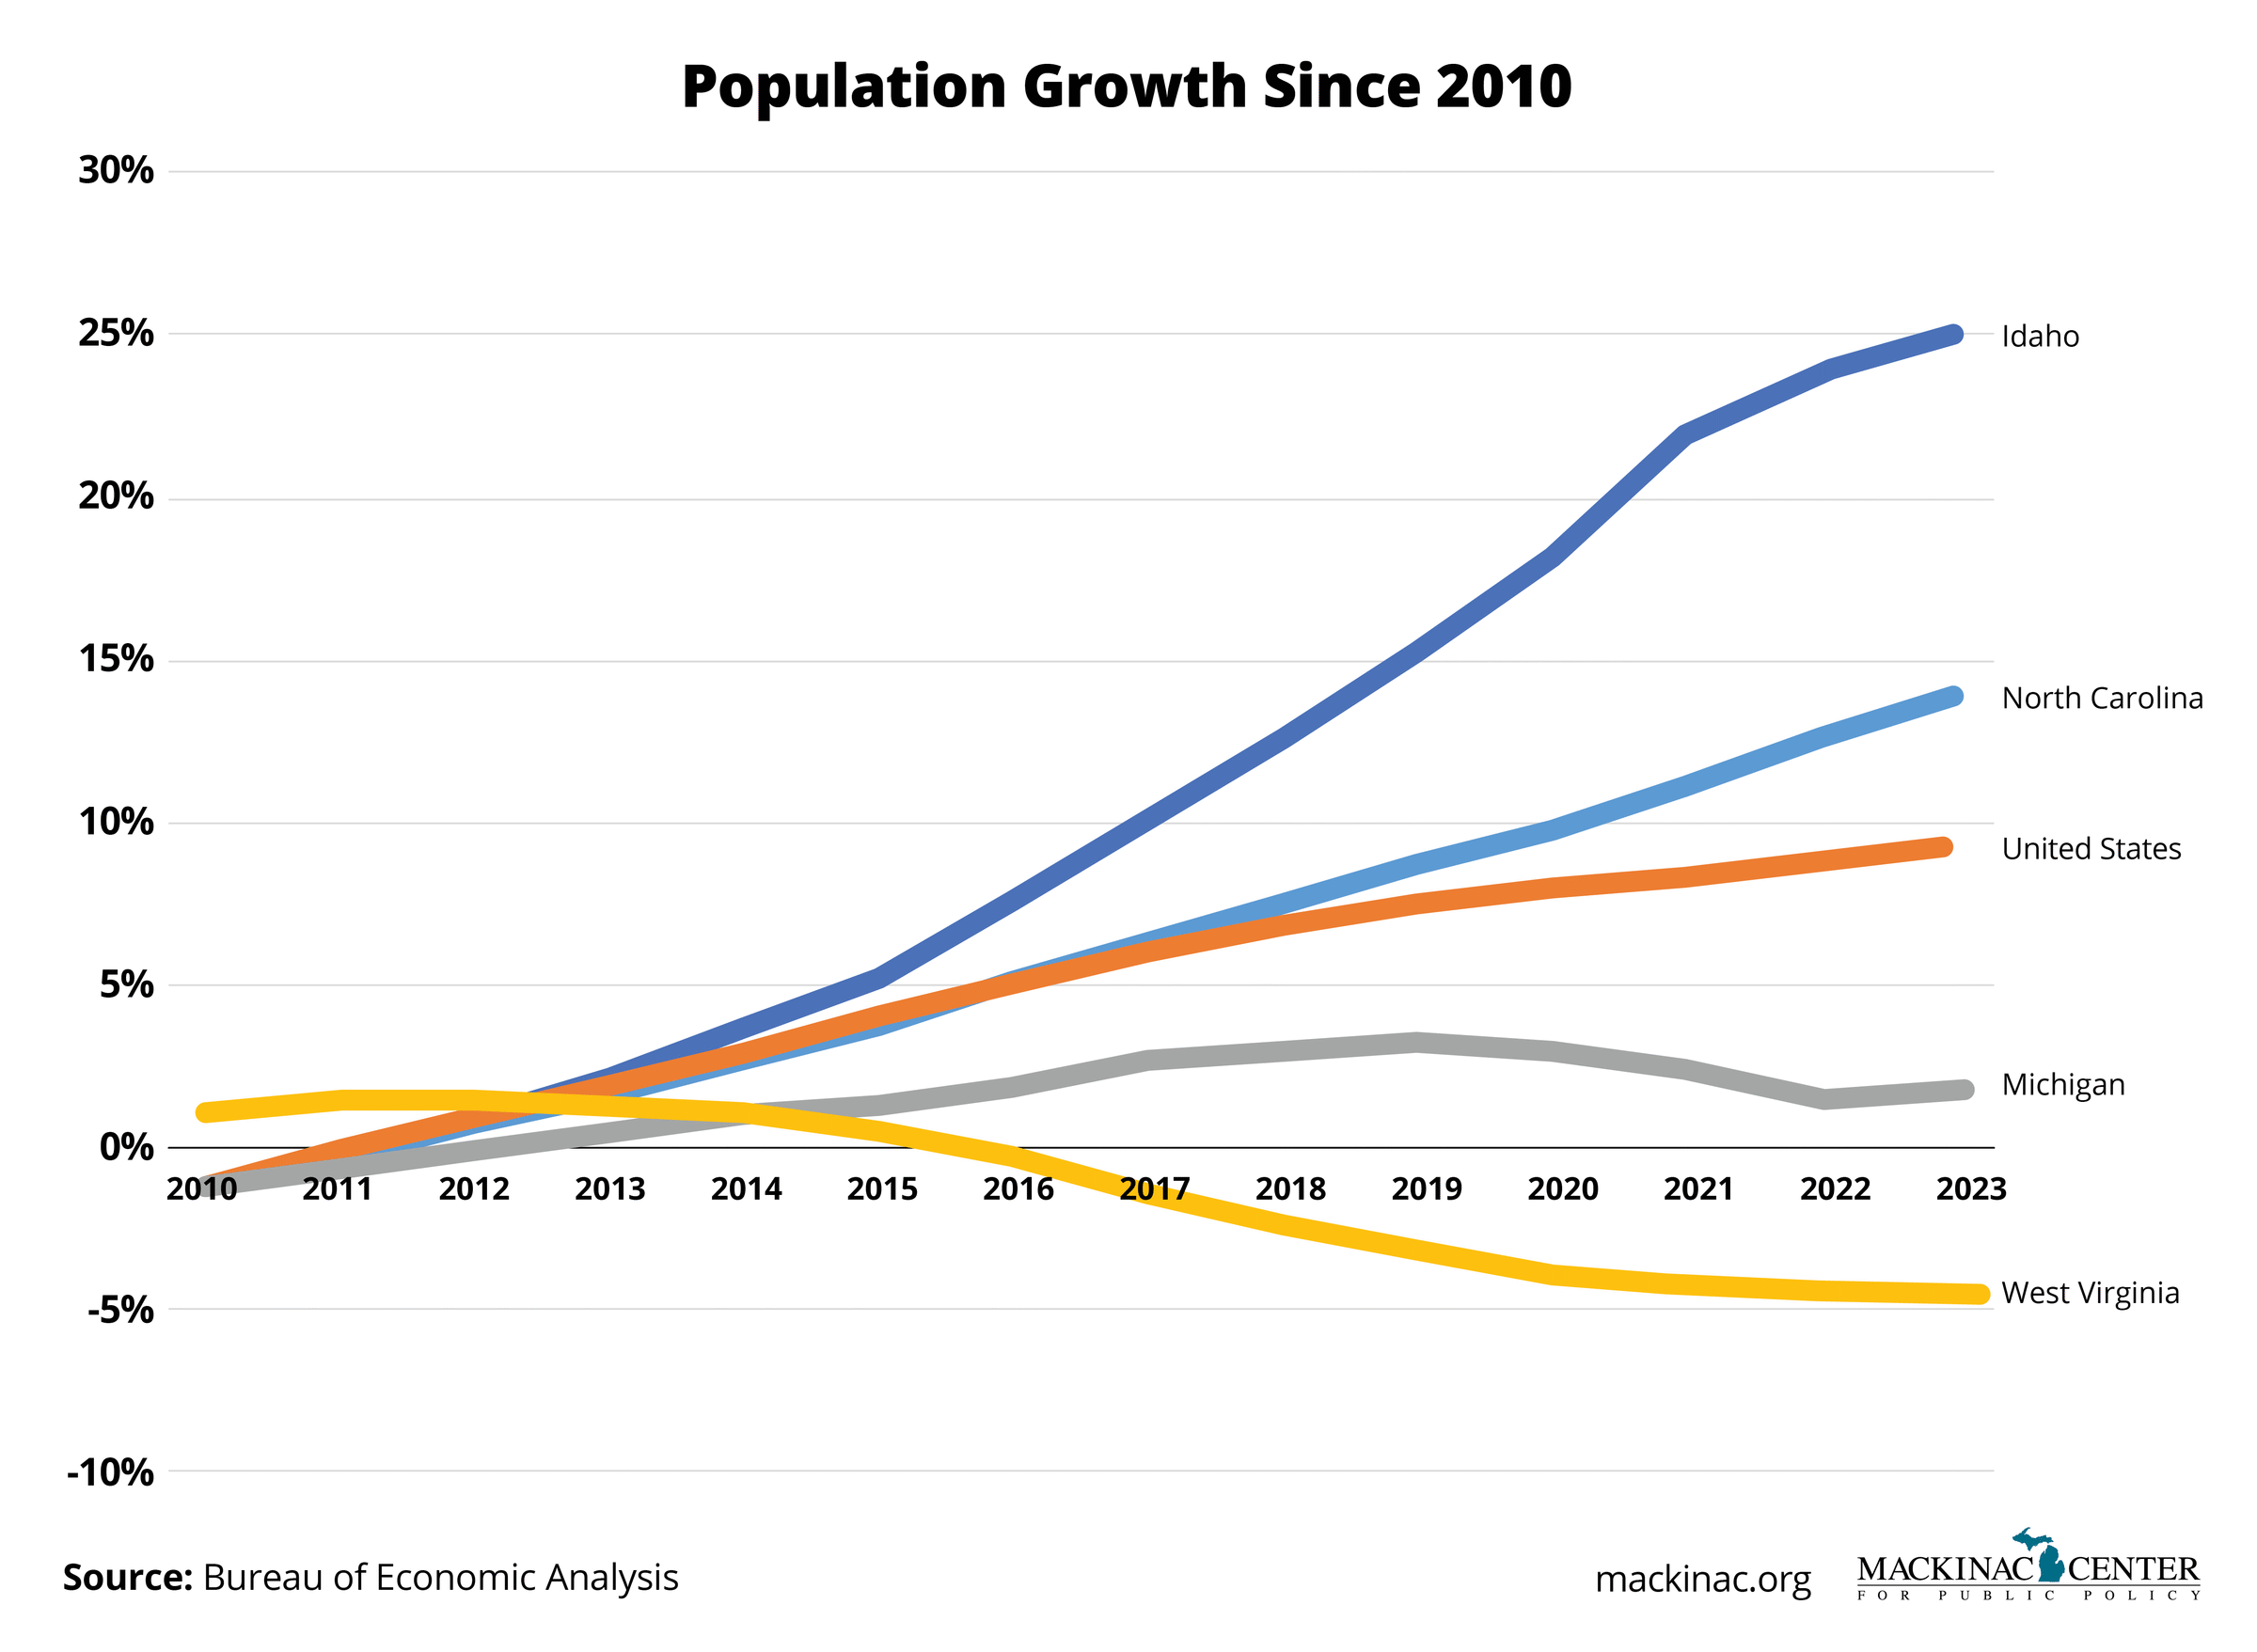
Even with the loss of auto jobs and stagnant population growth, though, the people of Michigan are better off than they used to be.
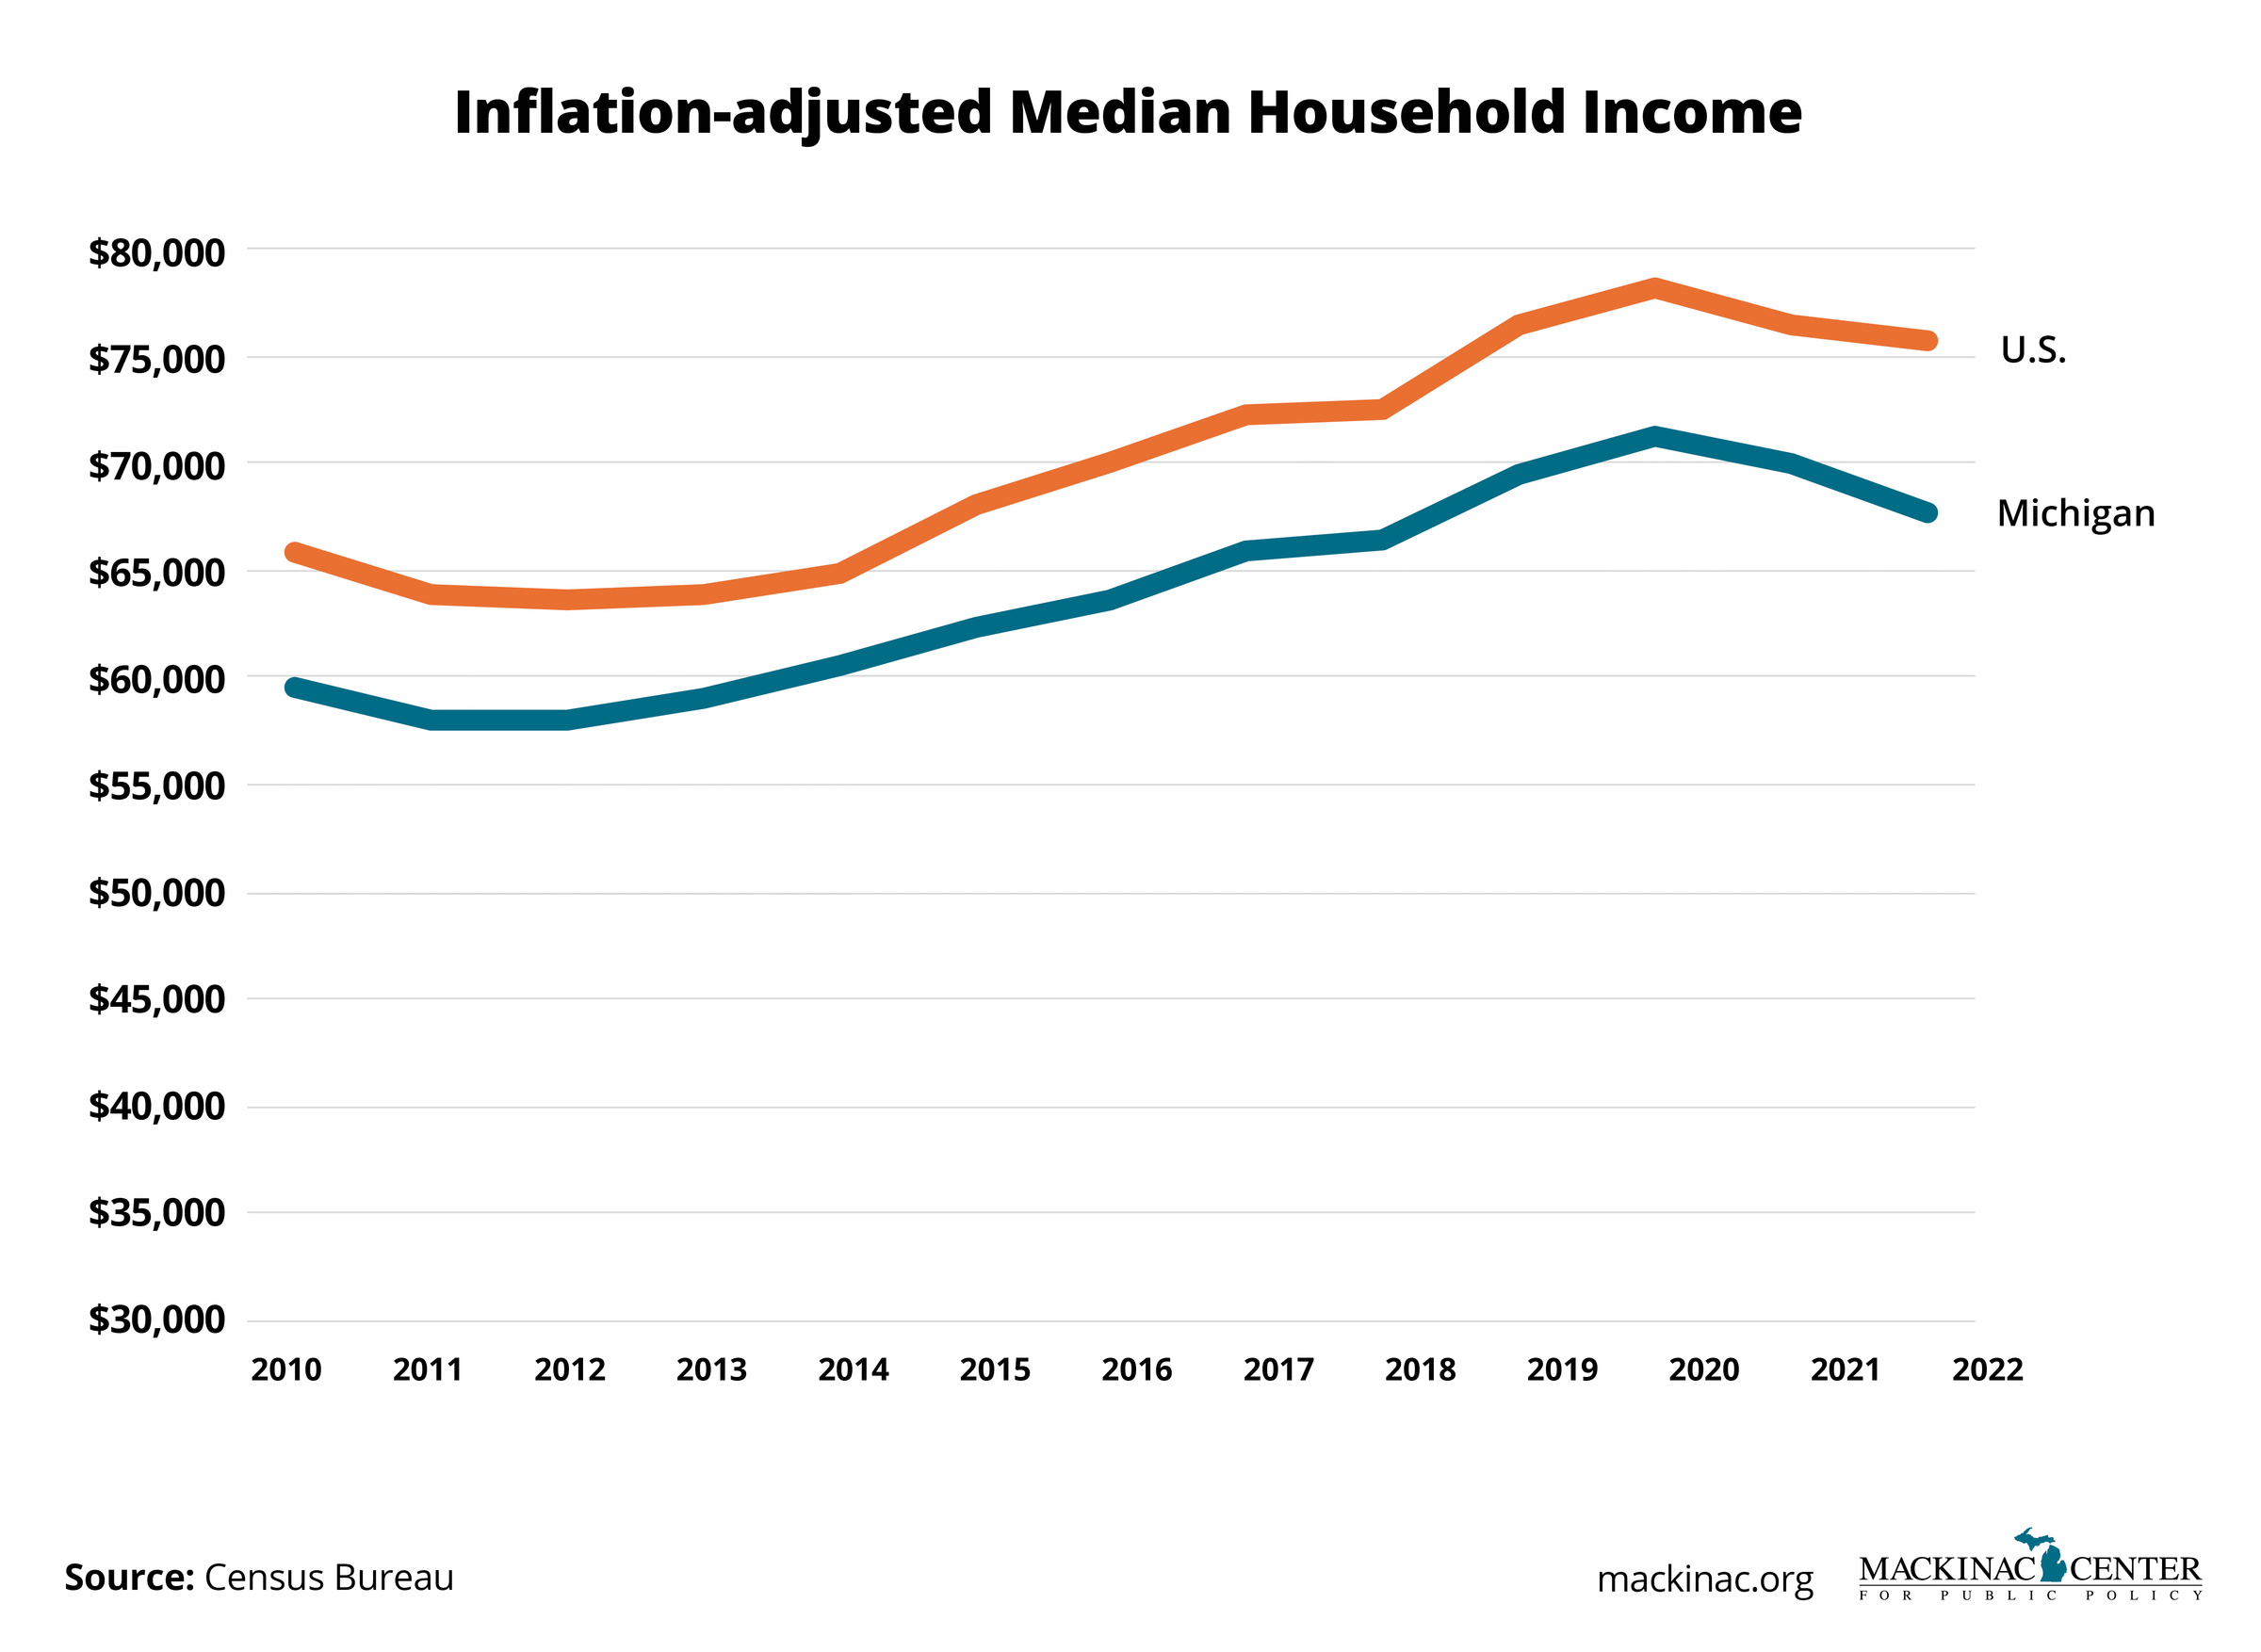
The median household in Michigan earns 10% more than in 2010, adjusted for inflation. Michigan is below the national average, but as this chart demonstrates, Michigan’s trends reflect the national average, with only minor differences in the rates over this period.
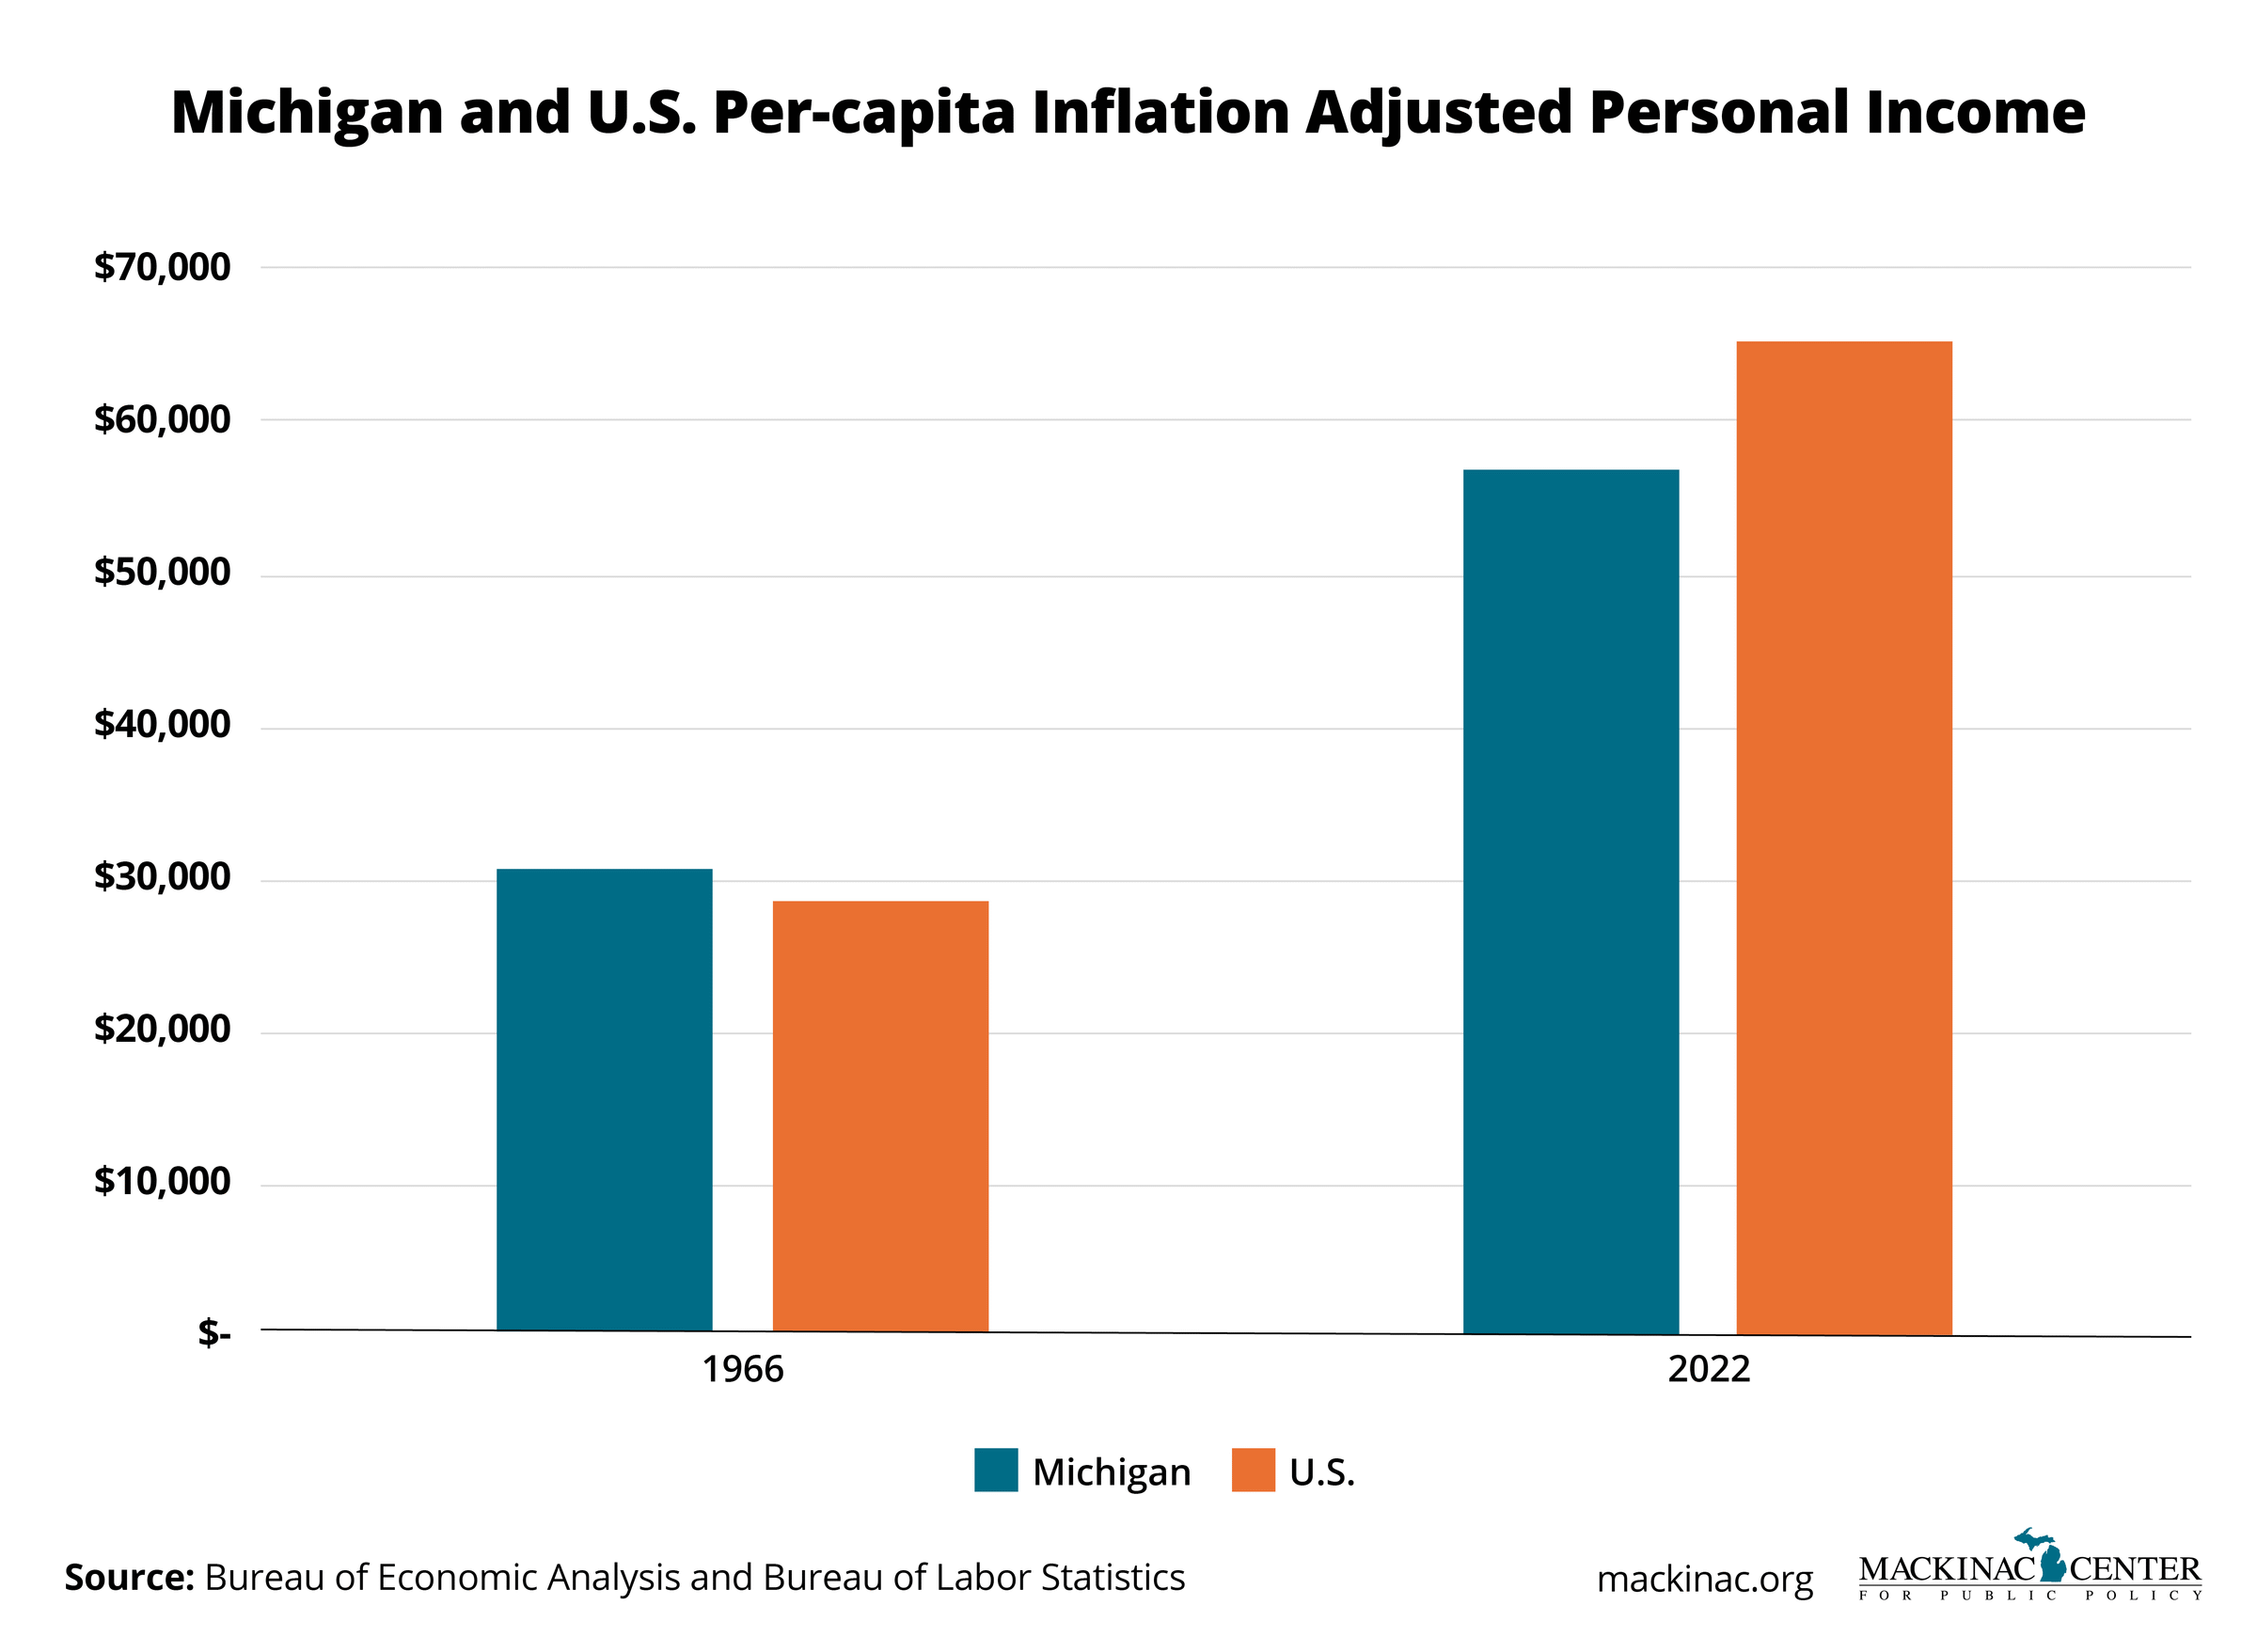
It’s not all bad. The United States is a wealthier country than it used to be, and Michigan has benefited. Although Michigan residents used to have higher income than people in the other states, incomes in the state today are less than the national average. Still, the average is up by a lot. Michigan ranked 12th among the states in per-capita personal income in 1966 and is 40th now. Average income was also 46% lower than it is today, adjusted for inflation, when the state was ranked higher. Michigan was one of the wealthier states in the past, but the past was also poorer than today.
To summarize, the auto industry employs half the number of Michigan residents it employed in 2000. The 2000s were bad for the state, and the lack of growth continues to this day. Yet people also earn a lot more than they did when Michigan was a higher-ranking state.
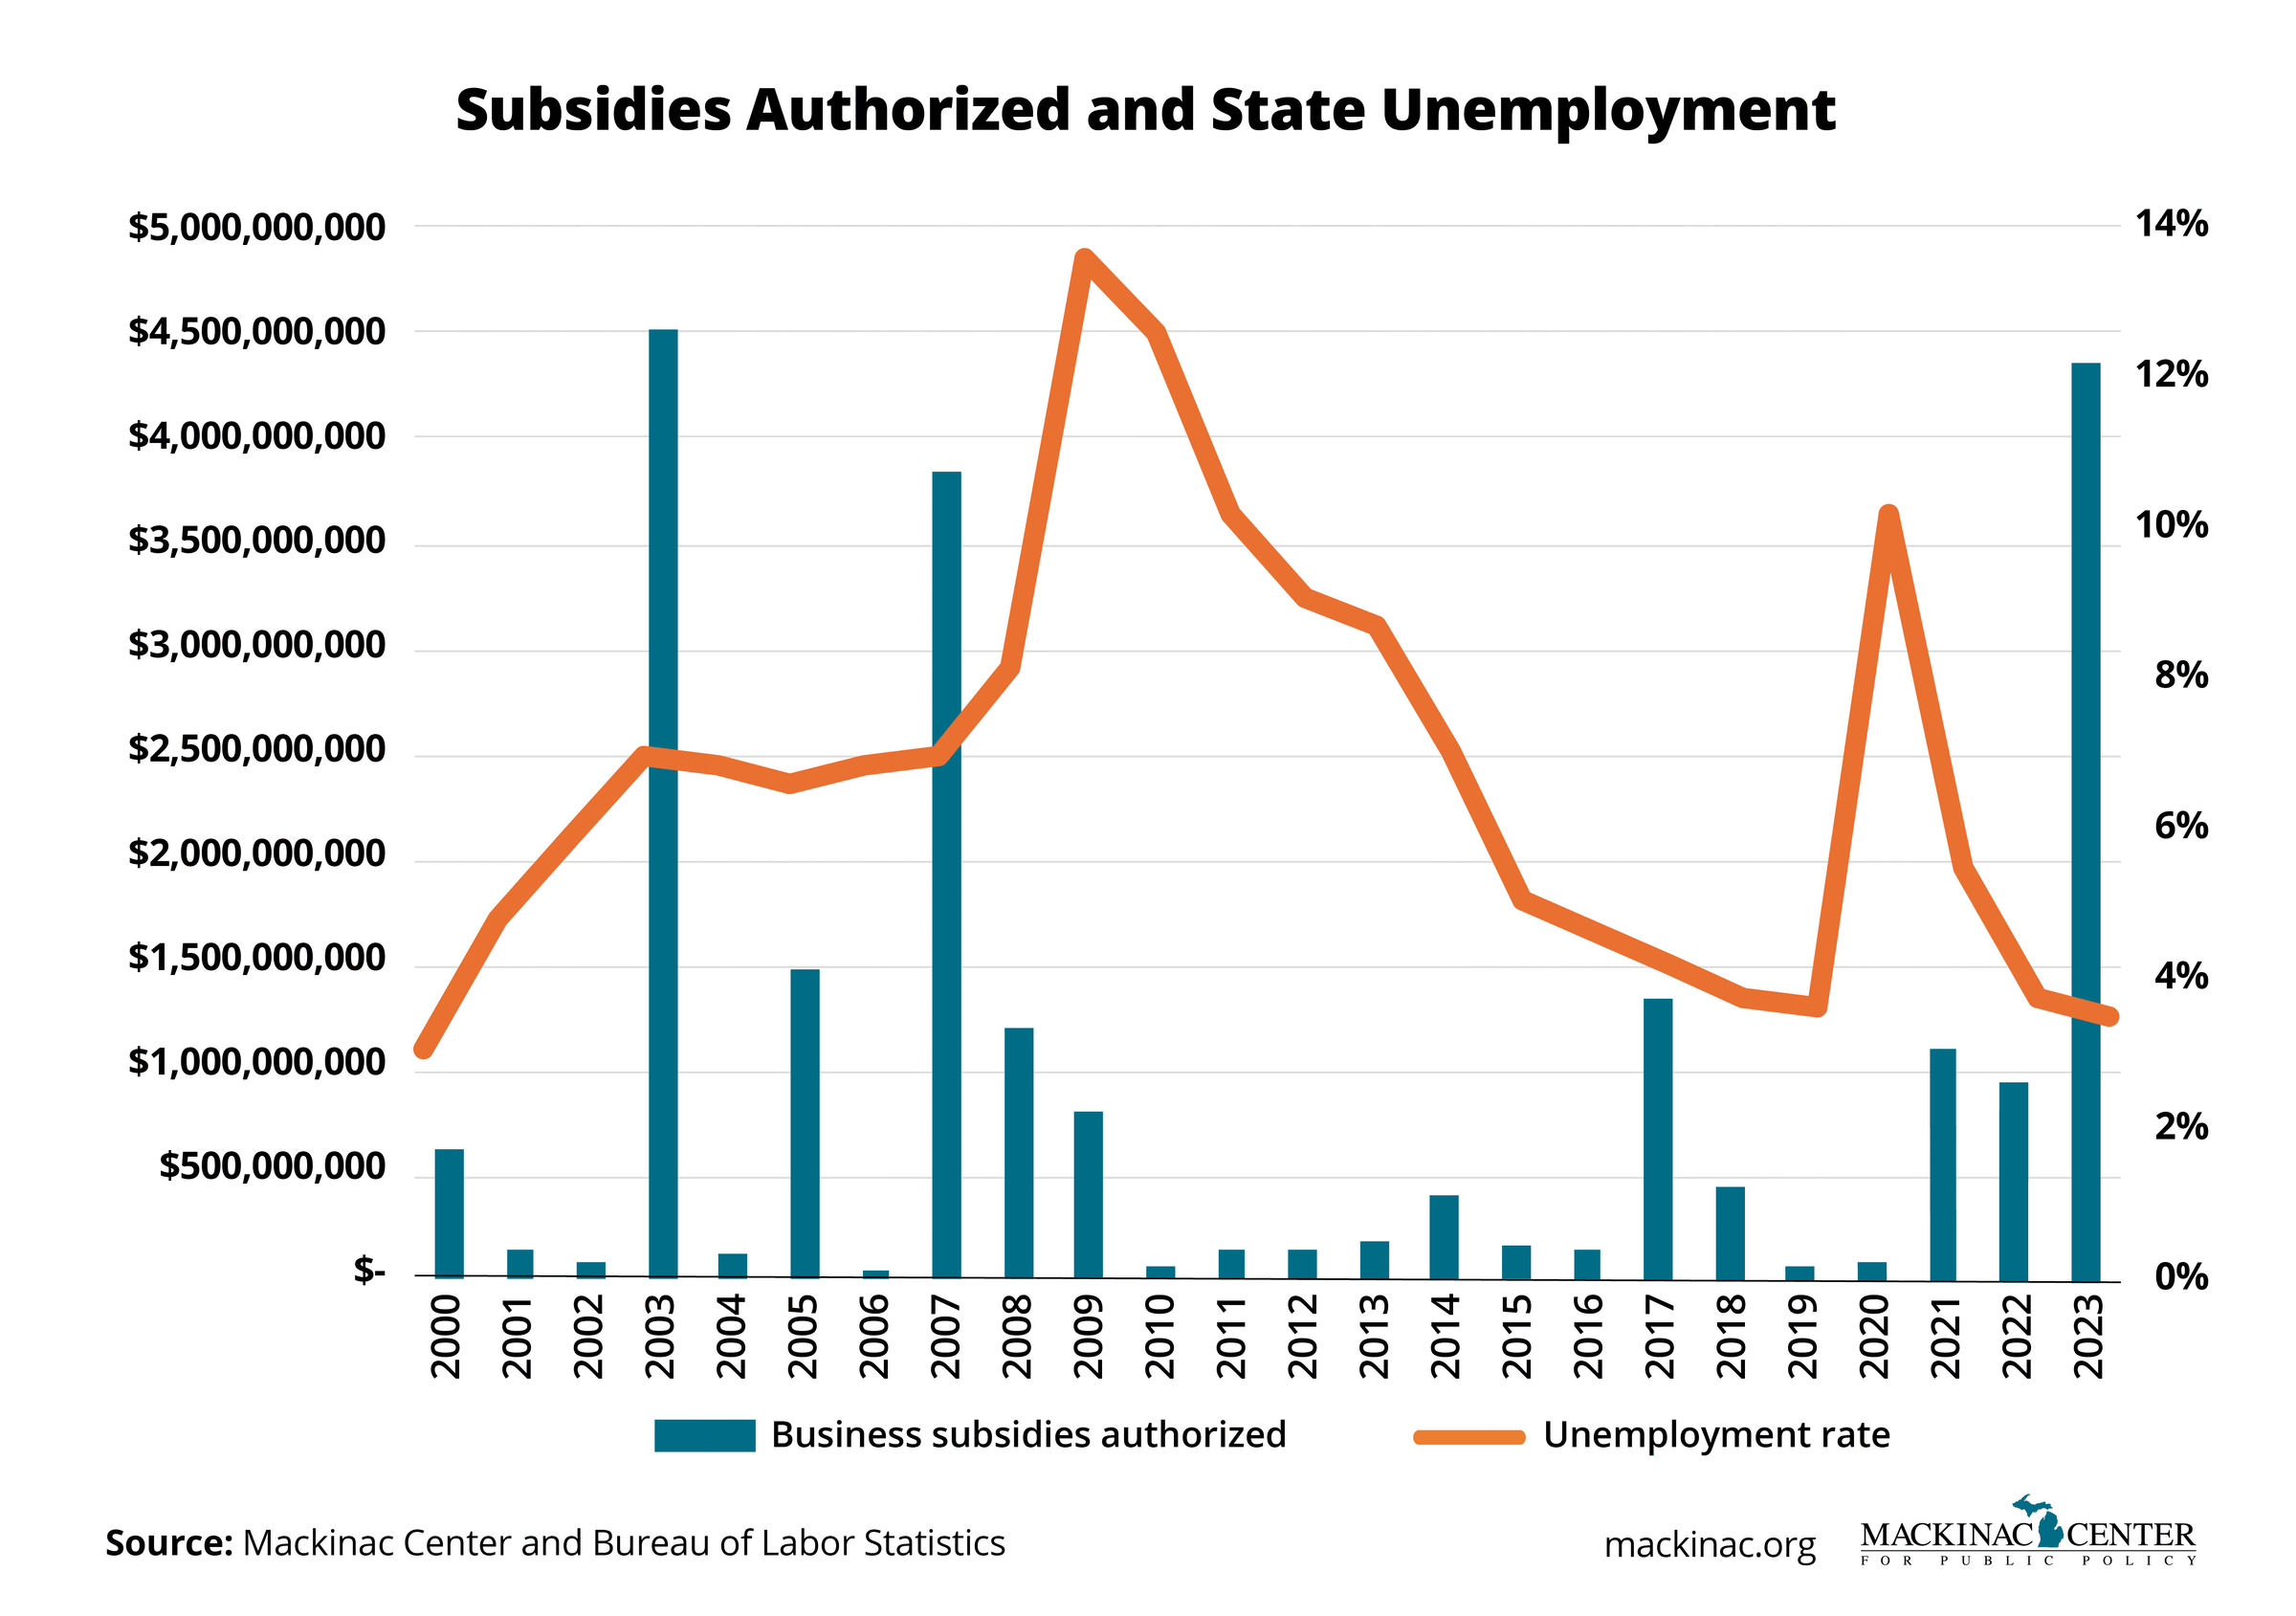
What about the state government’s response to its economic situation? Unfortunately, the state’s economic development policies have too often been to hand out big checks to select businesses. Michigan has authorized around $1 billion in business subsidies per year since 2000. Subsidizing corporations is a bigger priority for lawmakers than the state police.
Corporate welfare has fallen in and out of fashion among lawmakers. Subsidies were big in the Granholm and Whitmer administrations and never completely out of the picture in the Snyder administration.
Handing out checks to big business has done little to improve Michigan’s economic performance. The state’s unemployment rate declined the most when it was authorizing the fewest business subsidies, and it increased the most as the state was authorizing more.
This is not to say that more subsidies cause economic losses. Careful economic assessments tend to demonstrate that subsidies are unhelpful but not so important as to drive state economic trends. Business subsidies are bad policy because they are ineffective at creating jobs — their intended function — unfair to businesses that don’t get them, and expensive to the state budget.
What matters are the basics. States that respect private property and free exchange rather than government control do better than states with more intervention into people’s economic affairs. Good rules matter, as they foster mutually beneficial trade that better uses the resources of the world to meet people’s wants and needs.
The states that protect economic freedom are adding more jobs than the states with less economic freedom.
This chart shows how the 50 states scored on the Fraser Institute’s Economic Freedom of North America index and how their job numbers recovered from where they were before the COVID-19 pandemic began. Each state is a dot. The further right a state is on the chart, the higher it scores in economic freedom. The higher it is on the chart, the more jobs the state has added.
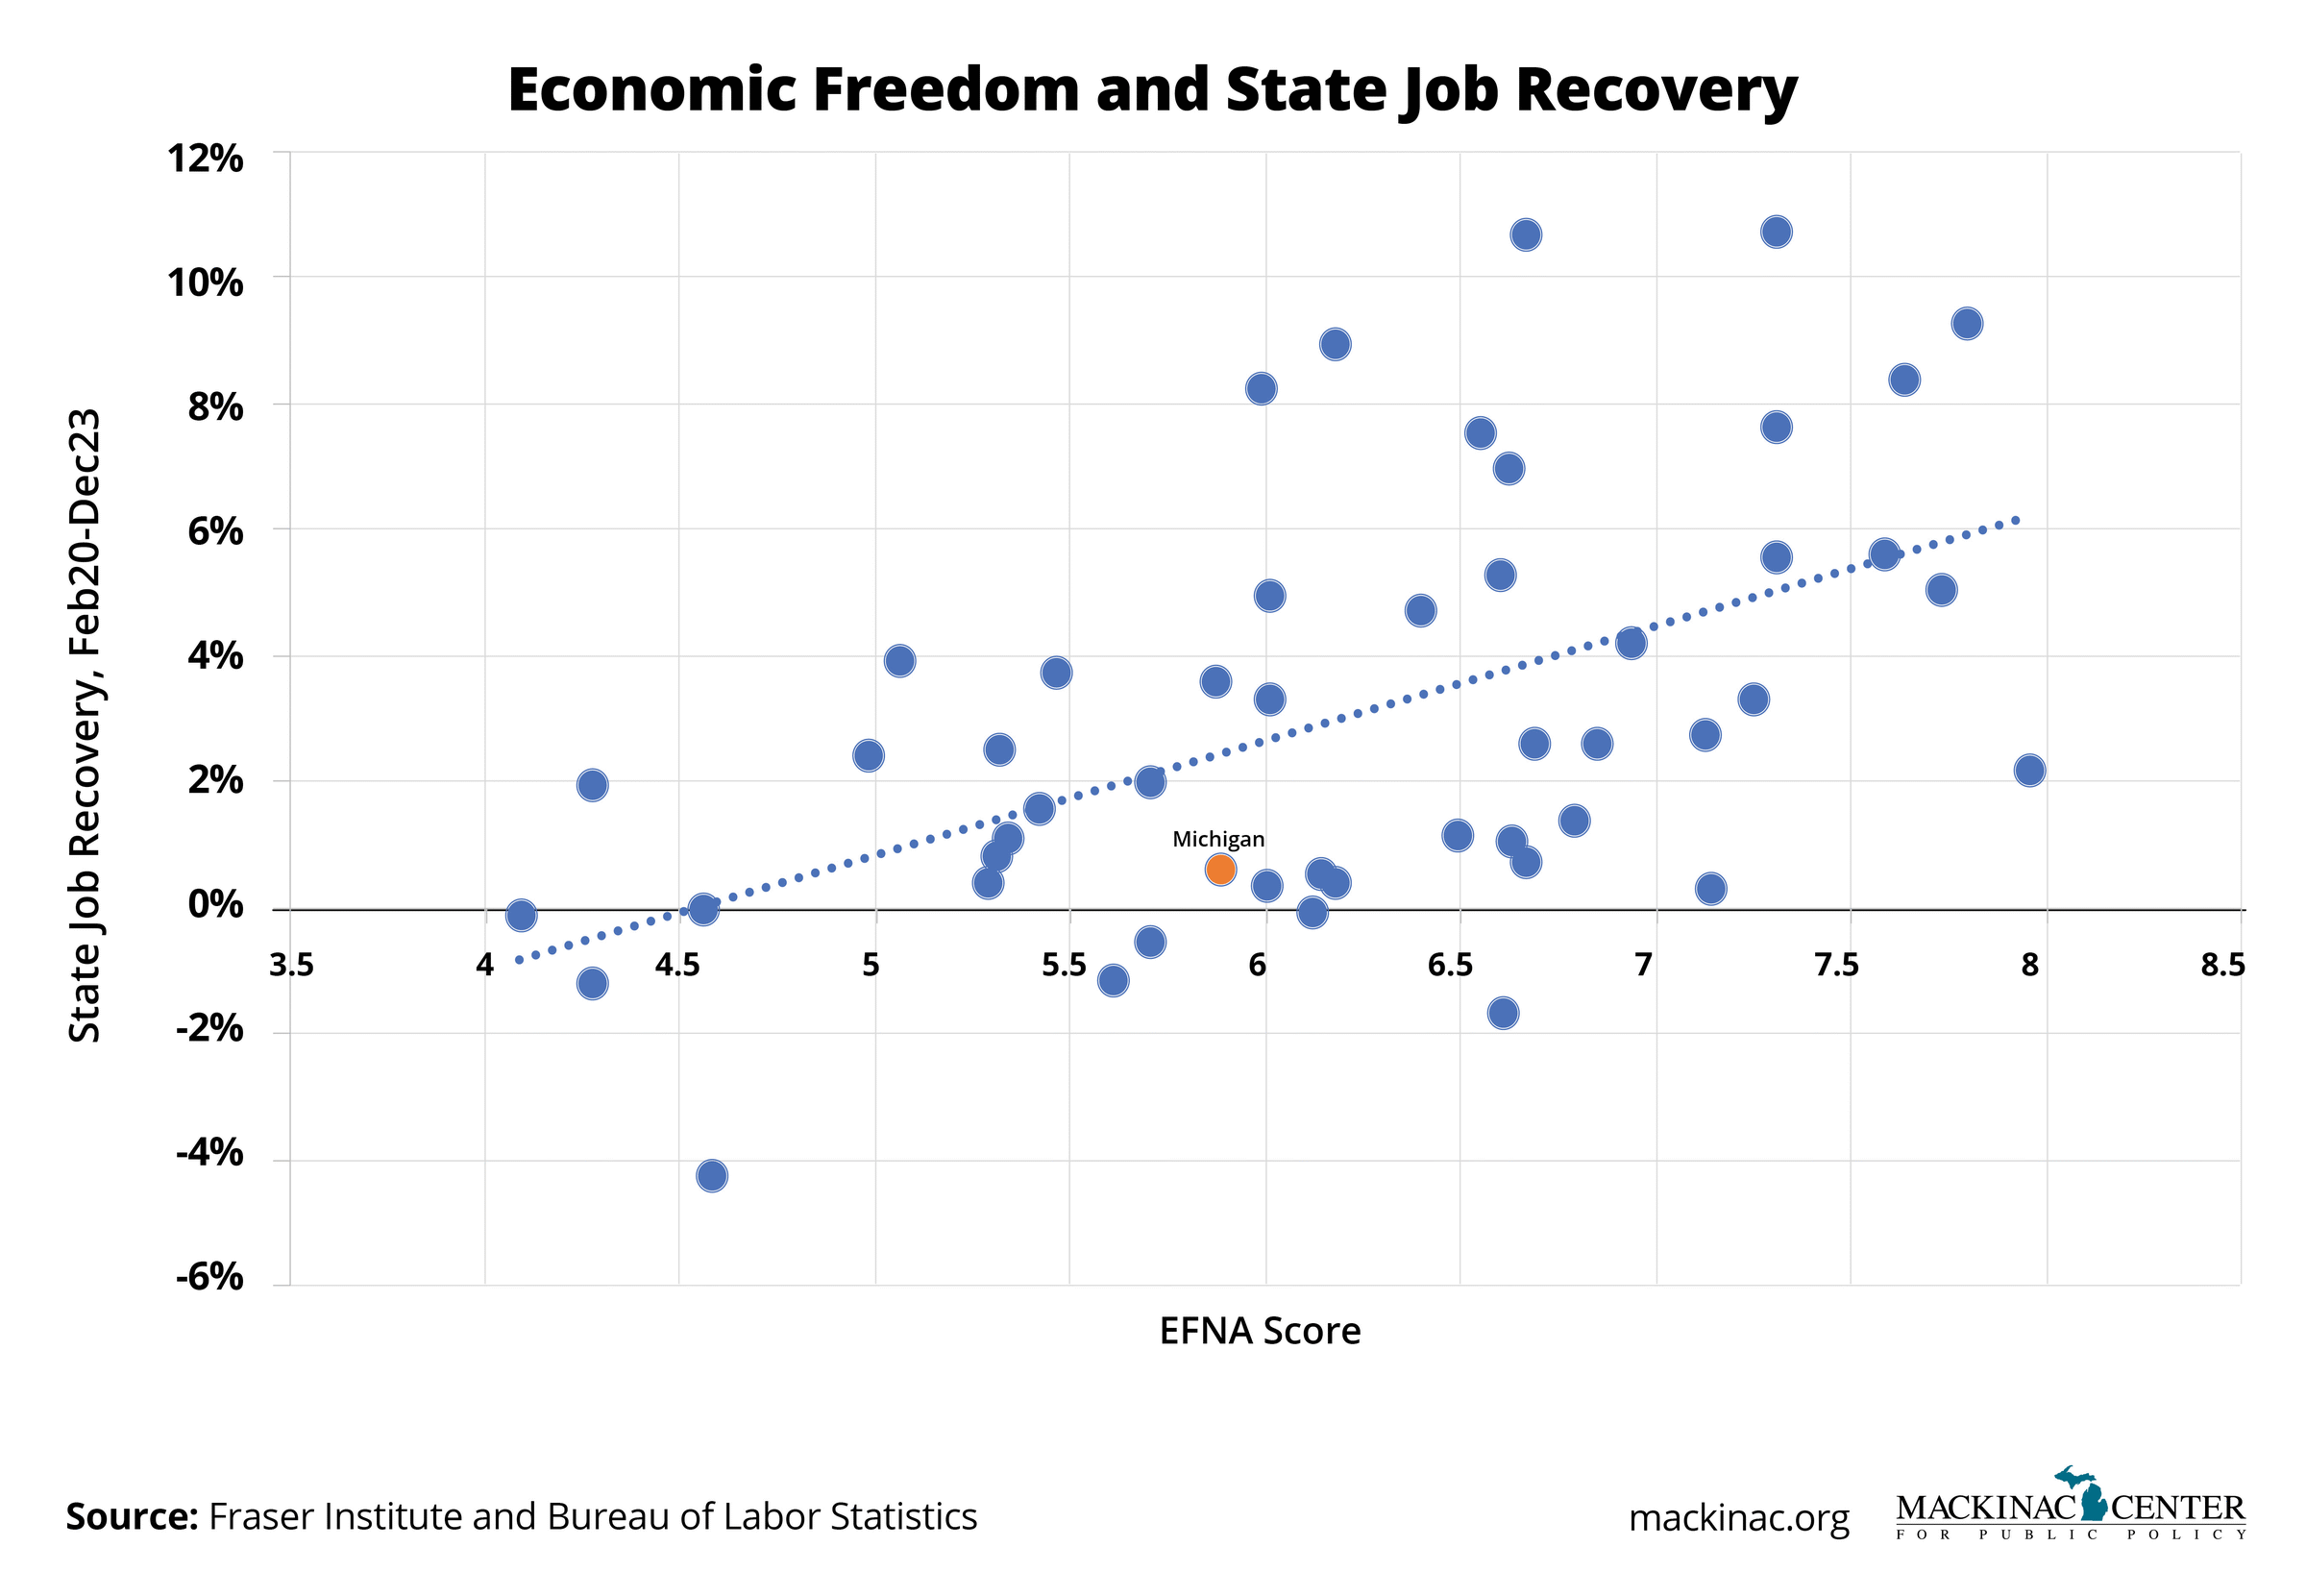
The states are clustered around a line that goes up and to the right, meaning that the more economic freedom a state has, the more jobs it has added. Note that every state isn’t aligned onto a straight line. There are many things that determine a state’s growth. Economic freedom, however, is a powerful determinant of state economic performance, and it is one that is under the direct control of state lawmakers.
Michigan’s population has been stagnant. Resident incomes are up. Auto jobs are down. Corporate welfare doesn’t work and economic freedom does. All in six charts.
Michigan Capitol Confidential is the news source produced by the Mackinac Center for Public Policy. Michigan Capitol Confidential reports with a free-market news perspective.
 U.S. Census report for 2022 shows migration from Michigan
 Michigan job, population numbers fall behind national trends
 Michigan job numbers don’t reflect Whitmer’s hype